The first four months of 2026 have rewritten the assumptions most investors carried into the year. By early March, a market that had entered January expecting modest oil oversupply, falling inflation, and a continuation of the AI-led equity rally was instead absorbing the largest oil supply shock ever recorded.
The Strait of Hormuz — the chokepoint through which roughly a fifth of the world's seaborne crude moves — was effectively closed from late February following US and Israeli strikes on Iranian infrastructure. Brent crude jumped 63% in March alone, the largest monthly gain on record, with physical cargoes briefly clearing near** $150 per barrel** as buyers scrambled for replacement supply.
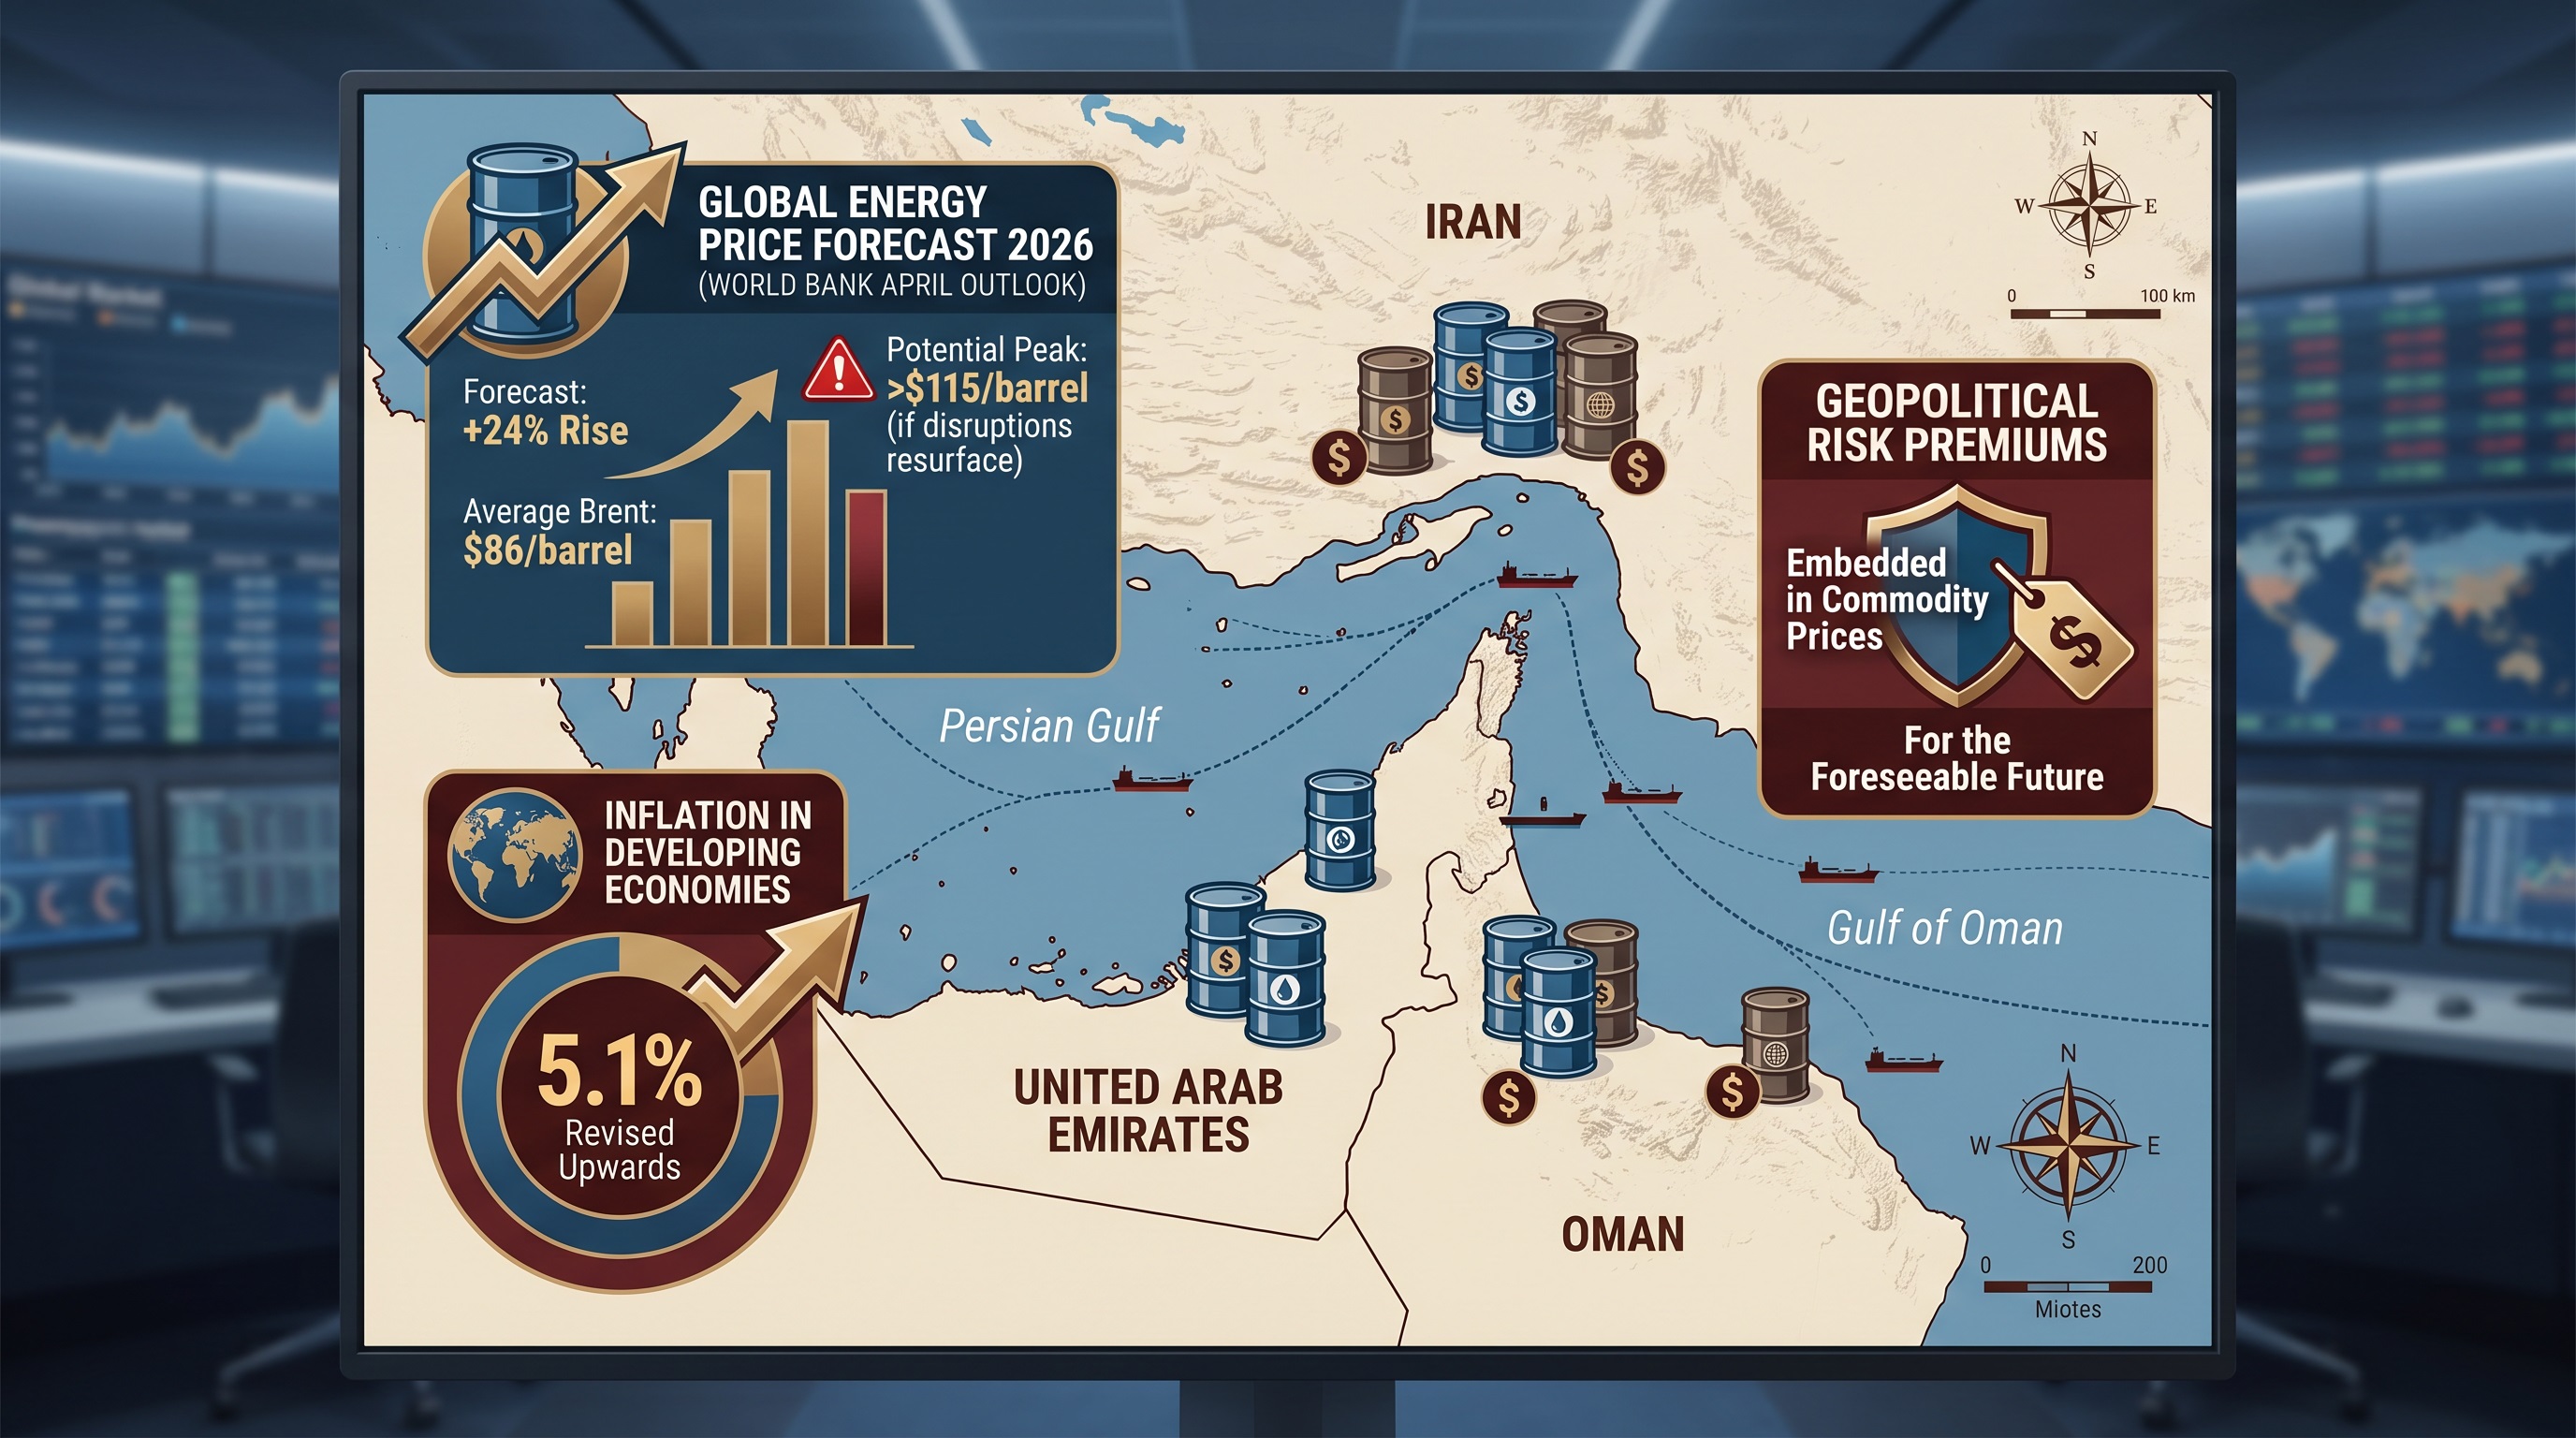
A ceasefire took hold in early April, and on 17 April Iran formally declared the Strait fully reopened to commercial vessels — but the pricing reset has not unwound. The World Bank's April Commodity Markets Outlook now forecasts global energy prices to rise 24% in 2026, with** Brent averaging $86 per barrel **for the year and potentially exceeding $115 if disruptions resurface.
Inflation in developing economies has been revised up to 5.1%. Central banks that were preparing rate cuts in January are confronting a textbook stagflationary problem: monetary policy cannot reopen a shipping lane.
The energy shock of 2026 has, therefore, forced a wholesale rethink of portfolio construction, inflation hedging, and the assets that can be relied on when geopolitics overrides monetary policy.
The practical question for investors is no longer whether the shock matters — it does, and its effects on commodity, currency, and credit markets will run well beyond the immediate price spike.
The question is how to reposition a portfolio for an environment in which energy is structurally more expensive, supply chains are being redrawn around political alignment rather than cost, and the assets that worked in the disinflationary 2010s are not the ones that will work in the 2020s.
This piece walks through what actually changed in Q1, the supply chain realignment that is now accelerating, the asset classes responding to the new regime, and the specific portfolio actions worth considering before the next leg of repricing.
Schedule a confidential consultation** to review how your portfolio is positioned for the environment ahead.**
What Actually Changed in Q1 2026
It is worth being precise about the shock, because the temptation is to treat it as a passing geopolitical episode. The data argues otherwise.
- Supply disruption scale: The IEA estimates Middle East crude production shut-ins peaked at around 9.1 million barrels per day in April. Global oil inventories drew down by 5.1 mb/d in Q2 — the sharpest decline since the early Covid period, but in the opposite direction.
- Refining strain: Asian and Middle Eastern refineries cut runs by 6 mb/d in April. Middle distillate cracks (the margin on diesel and jet fuel) hit all-time highs above $290/bbl in Singapore.
- Demand response: Global oil demand is now expected to contract by 80,000 barrels per day in 2026, against earlier forecasts of 730,000 barrels per day of growth.
- Knock-on effects: A 10% oil price increase from a geopolitical shock historically pushes natural gas up about 7% and fertiliser prices up over 5%, with the peaks landing roughly a year later. That delayed transmission means food and agricultural costs will likely rise into 2027 even if oil stabilises.
- Equity market split: The MSCI World Index fell 6.4% in March. Energy was the only sector to deliver positive returns, rising +12%, while consumer staples and healthcare — the usual defensive plays — fell 9% and 8% respectively. The S&P energy ETF (XLE) gained 37% in Q1 alone, with some component names like APA up over 73%.
The reopening of the Strait does not erase any of this. Inventory rebuilds take quarters, not weeks. The EIA expects Brent to average $76 in 2027, $23 above its February forecast. The risk premium is now embedded in the curve.
There is also a deeper point. The April Commodity Markets Outlook found that oil-price volatility during periods of rising geopolitical risk is roughly twice as high as during calmer periods, and that a geopolitically driven 1% decline in oil production pushes prices up by an average of 11.5% — with spillover effects to other commodity markets roughly 50% larger than under normal conditions. The system has become more sensitive to disruption, not less.
Supply Chain Realignment Is No Longer Optional

The energy shock has accelerated an ongoing structural shift in global trade—one that began with the US-China tariff escalation in 2018, intensified during the pandemic and Red Sea disruptions, and was already reshaping trade routes before February.
A 2025 survey of retail supply chain leaders found that 77% had already shifted sourcing away from China toward tariff-neutral countries. 87% had increased buffer inventory to hedge against volatility.
Apple has committed over $1 billion to Indian manufacturing and aims to move 15-20% of production to India and Vietnam by year-end. Section 232 tariffs in October 2025 added 10% on timber and 25% on cabinets and furniture, with rates rising to 50% on cabinets in January 2026. A 2025 Deloitte study estimated 40% of US companies would relocate at least part of their supply chains to North America by 2026.
The energy shock layers onto all of this. Higher fuel costs raise the breakeven for long-haul shipping and tilt the math further toward regionalisation.
The pattern emerging across regions is consistent:
- North America: Mexico is absorbing manufacturing redirected from China, supported by USMCA duty-free access. Labour costs are roughly 20–30% below China’s, though infrastructure constraints still cause delays. US–Mexico nearshoring is now the dominant freight growth story.
- Europe: Eastern Europe — particularly Poland — is gaining share as EU manufacturers nearshore from Asia. Friend-shoring is increasingly the operative concept rather than full reshoring; political alignment matters more than geographic distance.
- Asia: India and Vietnam are the principal China+1 beneficiaries. Intra-Asian corridors and the China-Central Asia-Europe routes are seeing rising volume.
- Logistics chokepoints: After the Red Sea disruptions and now Hormuz, transshipment hubs in the Gulf and along the Mediterranean have consolidated their strategic importance, with implications for port operators and integrated logistics names.
For portfolio construction, the implication is that companies and regions controlling mid-stream supply chain infrastructure — ports, rail, regional manufacturing capacity, critical minerals processing — are repricing upward as the cost of the old global system rises. This is a multi-year capex cycle, not a quarterly trade.
Where the Energy Shock of 2026 Is Resetting Asset Prices
Different asset classes are responding in different ways.
The table below summarises the moves through April 2026 and the directional bias from here, drawing on World Bank, IEA, EIA, and major bank research.
| Asset class | Q1 2026 move | Direction into H2 2026 | Why |
|---|---|---|---|
| Oil (Brent) | +50% YTD by mid-April | Range-bound $80-95 with upside risk | Risk premium embedded; OPEC+ spare capacity tight; 2027 forecast revised up $23/bbl |
| Energy equities (XLE) | +37% in Q1 | Selective; cash flow leaders favoured | Margins re-expanded, but only half the index components beat the ETF |
| Gold | Hit intraday $5,419 in late Jan | Goldman Sachs target $5,400; JP Morgan $6,000-6,300 | Stagflation hedge; central bank buying; debasement trade |
| Copper, critical minerals | Multi-year highs | Structural bid | AI, defence, electrification all need the same inputs |
| Long-duration government bonds | Negative real returns | Cautious | Stocks and bonds correlate positively under supply shock |
| US large caps | Mixed; defensives lagged | Relative insulation | Lower direct energy import exposure than Europe and EM |
| European equities | Pressured | Rebound on de-escalation | Heavy reliance on Middle East energy imports |
| EM energy importers | Pressured | Selective recovery | Inflation, FX pressure, debt service strain |
| Uranium / nuclear | Strong | Continued bid | Energy security premium; AI power demand |
| Defence industrials | Strong | Continued | Sustained higher procurement budgets |
The pattern is consistent with prior supply-driven inflation episodes: real assets and producers of scarce inputs outperform; long-duration claims on future cash flows underperform; and traditional 60/40 portfolios lose their internal hedge as bond-equity correlations turn positive.
That last point deserves emphasis. For most of the past three decades, government bonds rallied when equities fell, providing a built-in hedge inside the standard balanced portfolio.
In March 2026, the 10-year US Treasury yield reclaimed 4.10% even as equities sold off and gold hit record highs — the classic 60/40 hedge stopped working.
This is the same dynamic that defined the stagflationary 1970s, and it is the single most important regime change for asset allocation.
For tailored guidance on adapting your asset allocation to the new regime, schedule a confidential consultation.
The Rotation Playbook
Translating the macro view into specific moves depends on starting allocation, currency base, and time horizon.
The following are the actions showing up most consistently across institutional research from Goldman Sachs, Morgan Stanley, JP Morgan, and others through Q1 2026.
1. Raise the Allocation to Gold and Real Assets
A** 5-15% allocation to gold has improved risk-adjusted returns across the past several supply-shock cycles**. Goldman Sachs has reaffirmed a $5,400/oz year-end gold target; JP Morgan Private Bank is now at $6,000-6,300; Morgan Stanley's CIO has publicly favoured a 60/20/20 portfolio strategy with gold as the inflation sleeve.

The case is less about a near-term price call and more about gold's role when the bond-equity correlation breaks down — which it has. Central banks themselves have been adding to reserves at the fastest pace in decades.
2. Be Selective in Energy Equities Rather Than Buying the Index
The XLE rally was real but uneven — half the holdings beat the ETF return and half lagged. The companies that benefit most from a sustained higher-for-longer oil regime are integrated producers with low breakevens, hedged production, disciplined capital returns, and clean balance sheets — rather than highly leveraged shale names where free cash flow is fragile.
Energy infrastructure (pipelines, storage, LNG export terminals) offers contracted cash flow with less direct price sensitivity, often paired with attractive dividend yields.
3. Add Structural Exposure to Critical Minerals and Supply Chain Infrastructure
Copper, lithium, nickel, rare earths, and uranium sit at the intersection of every major secular theme: AI, defence, clean energy, and electrification. Goldman's framing — that** **the bottleneck is materials, not capital — is a useful lens.
Three decades of underinvestment in natural resources, as veteran investor Rick Rule has noted, has left the system structurally short. Exposure can be taken via diversified miners, dedicated thematic ETFs, or directly through equity in companies controlling sourcing, processing, and recycling capacity.
4. Tilt Equity Exposure Toward US Large Caps and Away From Energy-Importing Markets, for Now
US relative insulation is a function of domestic energy production; the advantage shrinks as the conflict de-escalates and import-dependent regions rebound.
Europe and Asian energy importers face a tougher 2026 but offer better entry prices for patient capital. The position is tactical rather than structural.
5. Shorten Bond Duration and Use Flexible, Multi-Sector Strategies
With central banks unable to ease aggressively into a supply-driven inflation, long bonds are not the hedge they were in the 2010s. Floating-rate credit, short-duration investment grade, TIPS (or local-currency inflation-linked equivalents), and dynamic strategies that can shift between rates and credit are better suited to the current regime.
Within fixed income, the case for emerging market local currency debt is more nuanced — a weaker dollar would help, but the energy import bill is a headwind for many issuers.
6. Build a Defence and Security Sleeve
Defence industrials, cybersecurity, and select aerospace names benefit from the structural shift in government spending priorities.
The combination of NATO commitments, Asia-Pacific rearmament, and ongoing conflict has put procurement budgets on a multi-year upward trajectory regardless of which way individual elections move.
7. Maintain Liquidity for the Next Dislocation
The single most useful lesson from Q1 2026 is that the market repriced violently in both directions within six weeks. Investors who held cash were able to add to risk assets at meaningful discounts in mid-March; investors who were fully deployed were not.
Keeping 5-10% in liquid reserves is unglamorous, but optionality is worth more than usual right now.
The Three Scenarios Worth Planning For
Three scenarios are worth holding in mind through the rest of 2026.
The base case — which most institutions now anchor to — is that the Strait remains open, oil settles in the mid-$80s, inflation runs roughly a percentage point above pre-conflict expectations, and central banks deliver less easing than markets had priced in January. Real assets and selective equities outperform; bonds underperform; supply chain regionalisation continues to attract capital.
The upside case is a durable peace and faster Middle East supply normalisation. Oil drifts toward the $60s, inflation cools, central banks resume easing, and the rally broadens beyond the energy and gold complex. Even in this scenario, supply chain regionalisation continues — that trend is structural rather than conflict-driven, and the capex commitments already made will not reverse.
The downside case is renewed escalation, a partial Hormuz reclosure, and Brent sustained above $115. Stagflation pressures intensify, equity markets correct further, and the dollar's safe-haven status comes under question as fiscal deficits widen to fund energy subsidies. Gold and selective energy producers are the clearest beneficiaries; long-duration assets and consumer-discretionary names are most exposed.
In all three scenarios, the direction of portfolio adjustment is similar. Investors should hold more real assets, more producers, and more regional supply chain exposure. They should hold less duration and less concentration in disinflation-era winners. The scenarios determine the magnitude of the tilt rather than the direction.
The Deeper Shift
The shocks of the past six years — pandemic, the 2022 commodity spike, the persistent inflation that followed, and now the 2026 supply crisis — have made one thing clear. The investing regime that prevailed from roughly 2009 to 2021, defined by ultra-low rates, disinflation, and frictionless globalisation, is over.
Inflation will be higher and more volatile. Real interest rates will be higher. Geopolitical risk premiums will be embedded in commodity prices for the foreseeable future. Supply chains will be designed around resilience and political alignment rather than pure cost minimisation.
The most common error in this kind of regime change is waiting for confirmation. By the time a new environment is universally accepted, the repricing has already happened, and the easiest gains have been captured. Q1 2026 is the early innings of that adjustment, not the closing chapter.
Portfolios built for the previous regime — heavy on long-duration growth equities, light on commodities and real assets, dependent on bonds as the equity hedge — need to be reviewed against the regime that has actually arrived. That review is not about chasing the latest move in oil or gold. It is about ensuring the underlying construction of the portfolio is fit for an environment in which the old correlations no longer hold, and the old playbook no longer protects.
The investors who do that work now are likely to be the ones whose capital compounds through what is shaping up to be a meaningfully different decade.
Book a consultation** with our team to review how your portfolio is positioned for the regime ahead and where the most consequential adjustments may lie.**
***The information above is based on data from the World Bank, International Energy Agency, US EIA, IMF, and major institutional research desks current to early May 2026. It is intended as analytical commentary and does not constitute personalised investment advice. Investors should consider their own circumstances, time horizons, and tax positions, ideally in consultation with an appropriately qualified advisor.
This article is for general information only and does not constitute financial, legal or tax advice. Rules, prices and regulations change; verify current requirements with a qualified adviser before acting.